The astroid curve is an example of a hypocycloid – a curve generated by rotating a fixed point on a small circle around a larger circle. Specifically, it is a hypocycloid with four cusps.

The curve can be defined parametrically by the equations $x=\cos^3(t),y=\sin^3(t)$. It’s fun to play with these equations by changing the coefficients of $t$. The curve stops being a hypocycloid and becomes something…else.
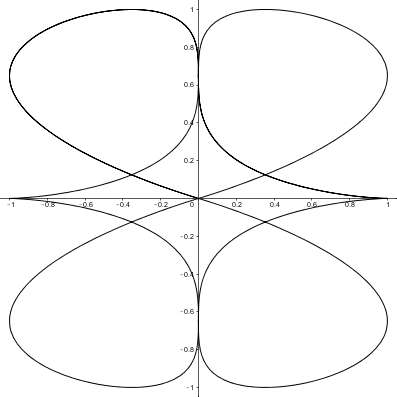
$y=\sin^3(t)$
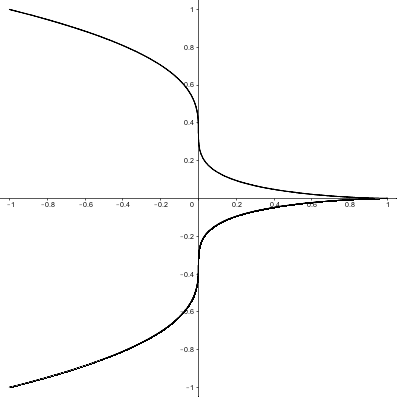
$y=\sin^3(2t)$
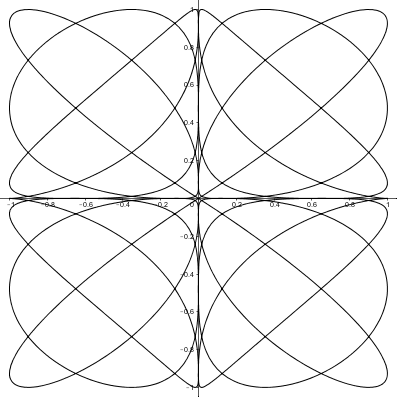
$y=\sin^3(6t)$
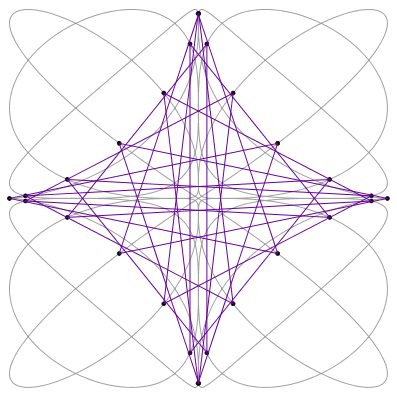
These curves are beautiful just as they are, but they can also be used for generating string art. Start by plotting points on the curve for equally spaced values of $t$. The next image shows points plotted for $t=0$ to $2\pi$ in steps of $\frac{\pi}{13}$ on the curve $x=\cos^3(7t), y=\sin^3(6t)$.
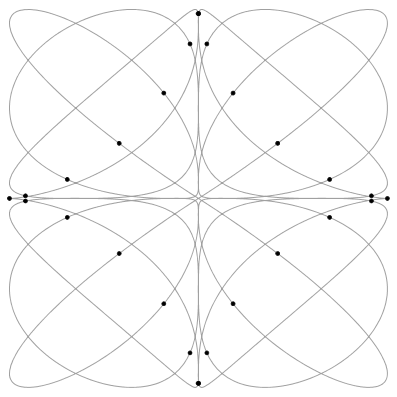
Then choose a value of $n$ and join every $n$th point with a straight line. Note this this is not counting in the order that the points appear on the image, but in the order of the value of $t$ that generated the point. Joining every $6$th point in the image above gives the following.
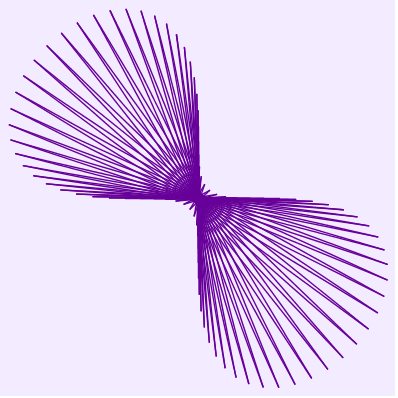
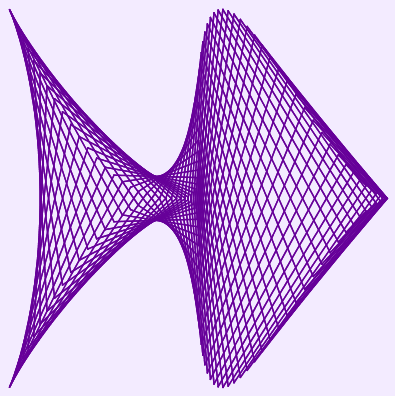
Changing the number of points and how they are joined produces a huge variety of images, some chaotic, some bland, some beautiful. There is a Geogebra applet here where you can experiment for yourself. I’ll leave you with a couple of my favourites – I call them Spiky Feathers and Geometric Fish. You can buy T-shirts featuring the Spiky Feathers design.

Leave a Reply